AutoLogis
AutoLogis is designed to help automate the process of assigning peaks in spectra from complex organic matter samples, or other similar complex samples, producing predominantly singly charged ions; e.g. metabolomics, crude oil, food aqueous extracts etc.
AutoLogis can assign peaks in mass spectra using two different methods: accurate mass and mass difference. In the accurate mass approach, AutoLogis will use both the accurate mass and isotopic distribution to assign identities to ions in spectra. In the mass difference approach, it uses the accurate mass difference between a known peak and an unknown peak to infer the formula of the unknown peak. By building a network of links between peaks in a spectrum you can assign most peaks from a single starting peak. Both approaches are highly automated and can be applied to batches of many (even hundreds or thousands) of spectra.
AutoLogis can also be used to help sequence proteins, ab initio, by help to highlight peaks that are separated by amino acid residue masses.
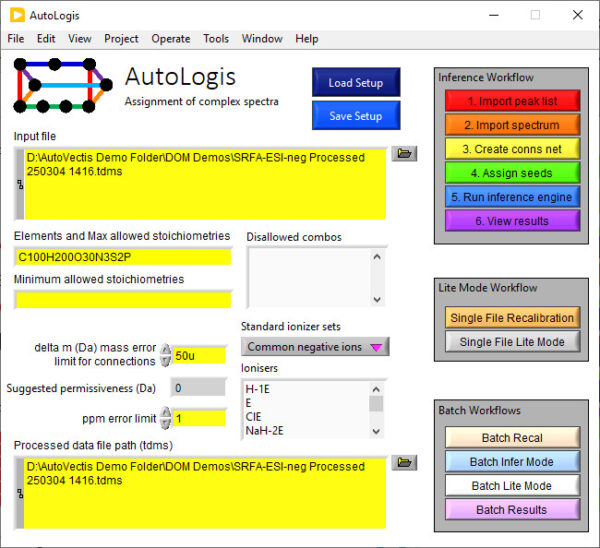
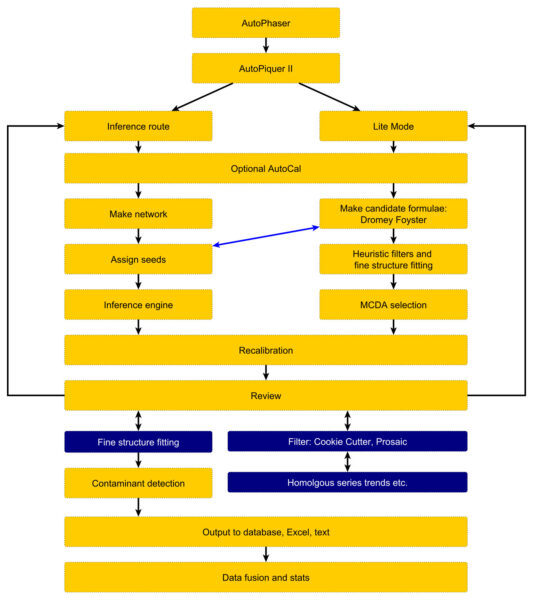
AutoLogis Workflows
AutoLogis can help assign complex spectra using two methods: via the “Inference route” (mass difference networks) and accurate mass/isotopic fine structure (“Lite mode”).
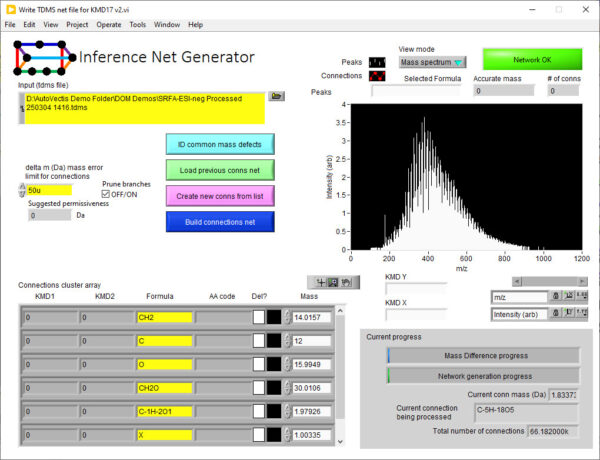
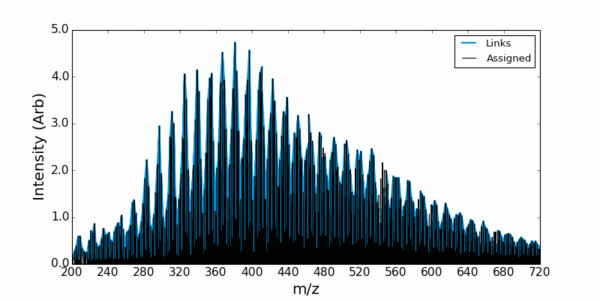
Assigning by Inference
The Inference Route assigns peaks by creating an inference network. Each peak detected in the mass spectrum is represented as a node in the network. The mass-to-charge ratio (m/z) of the peak is the key identifier for each node. Edges connecting these nodes are established based on specific mass differences between the peaks.
These mass differences correspond to known or suspected chemical transformations (e.g., addition or loss of CH₂, O, H₂O). You can predefine this list or detect and identify common differences in the data using the built in tools. When the mass difference between two peaks in the spectrum matches one of the predefined chemical transformations, an edge is drawn between the corresponding nodes. This creates a network where connected peaks are likely related by these chemical modifications.
If the elemental composition (and thus the exact mass) of one peak in a connected component of the network is known (e.g., through high-resolution mass spectrometry and isotopic pattern analysis), this information can be propagated to other connected peaks based on the mass differences (chemical transformations) linking them. i.e., the identity of unknown peaks can be inferred from the identity of other peaks in the spectrum via the network connections.
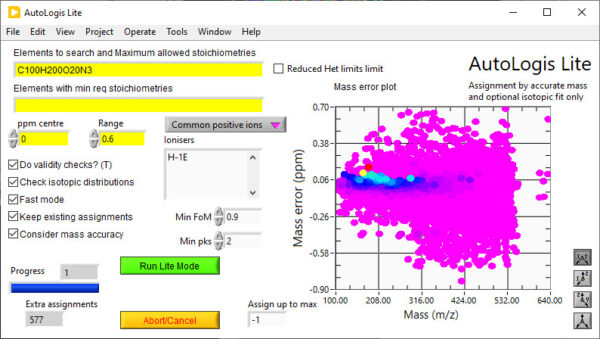
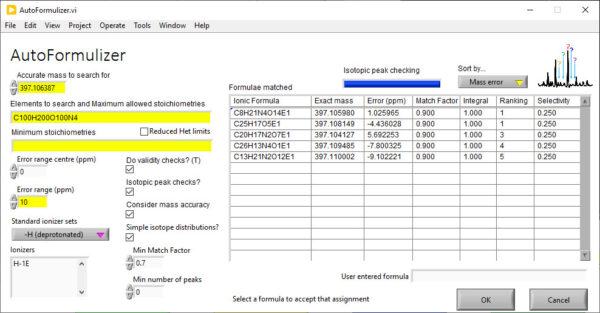
Lite mode – Assigning by accurate mass and fine structure
AutoLogis’ Lite mode permits users to assign identities to peaks in accurate mass spectra using both the accurate mass of peaks and their isotopic distributions. Under the covers, it uses the famous Dromey-Foyster algorithm for proposing an initial list of elemental compositions for each peak – within the mass error and stoichiometriic limits for each permitted element. This list is then filtered down using heuristic rules. The isotopic distributions for the filtered formulae are compared to the spectral peaks and then a unique muticriterion decision analysis (MCDA) method is used to propose the most likely formula for each peak.
Outputs
AutoVectis can output its assignments in many different formats, including publication ready graphs, tables, to Excel, as SQLite databates etc. If you need your results in a specific format for onwards processing, we will ensure that you have access to what you need.
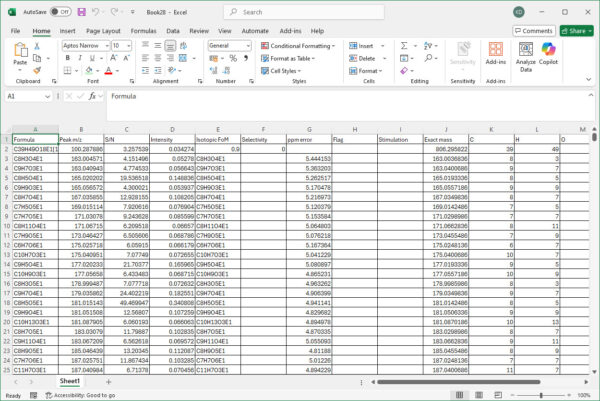
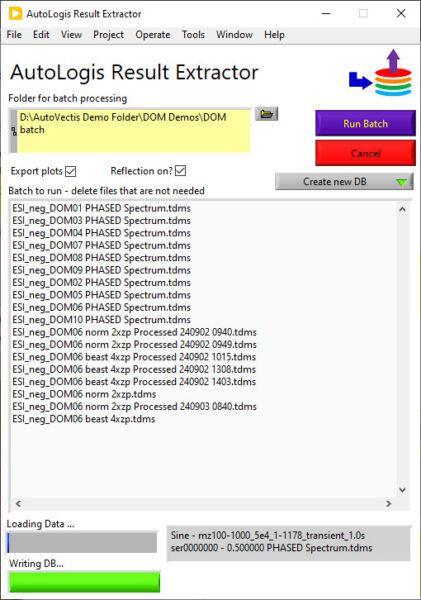
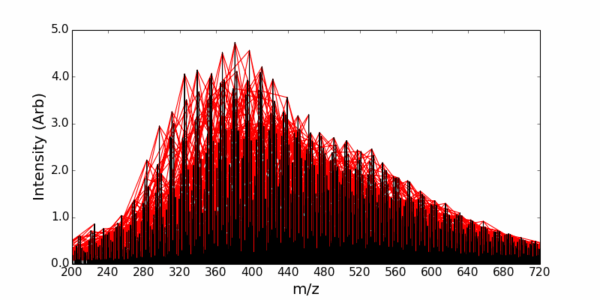
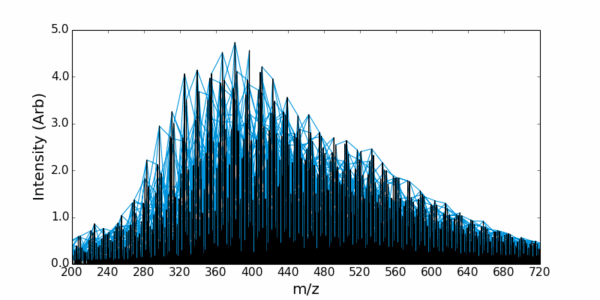
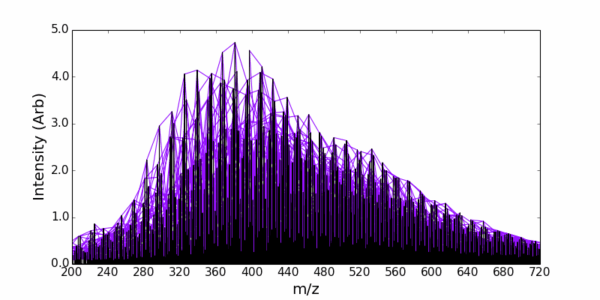
Example – Assigning DOM from Orbitrap data
AutoLogis also makes it easy to edit the assigned list (deleting suspicious assignments) and to recalibrate your data, based on the assignments.
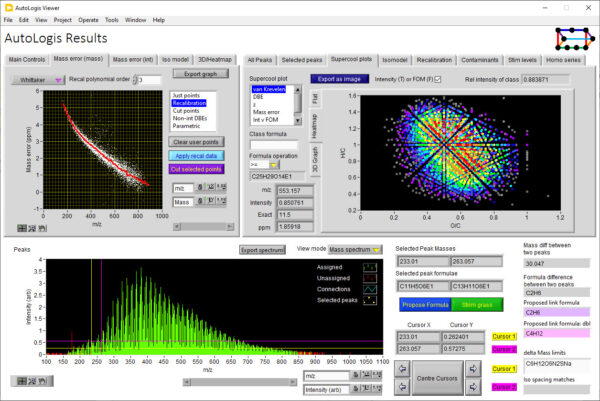
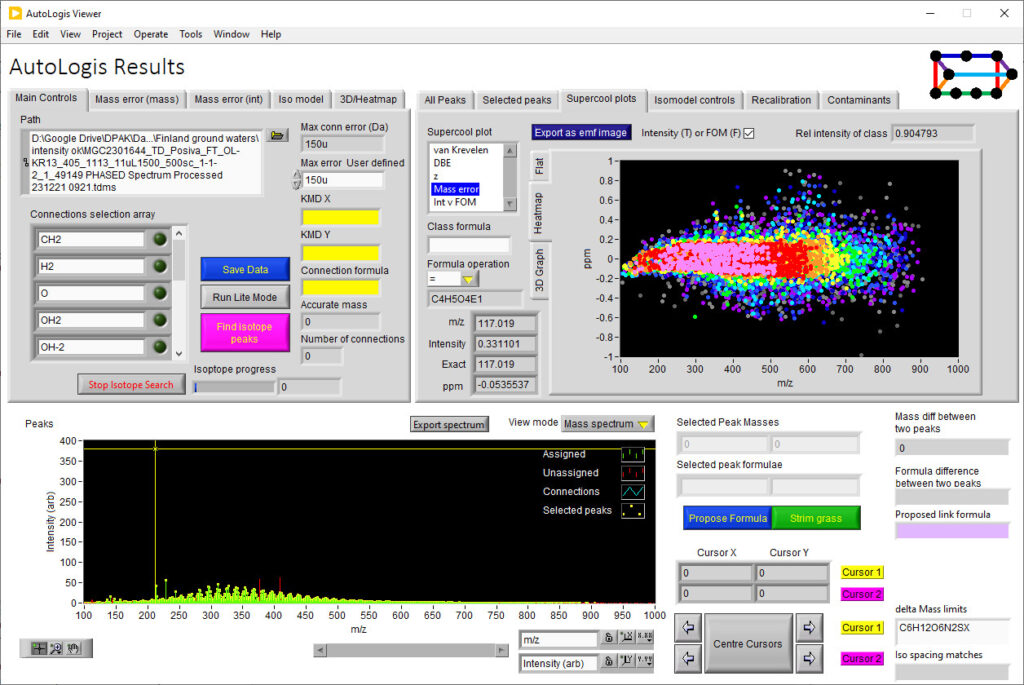
AutoLogis Data Viewing
AutoLogis has a dedicated results viewing tool to help you review and expore your results.
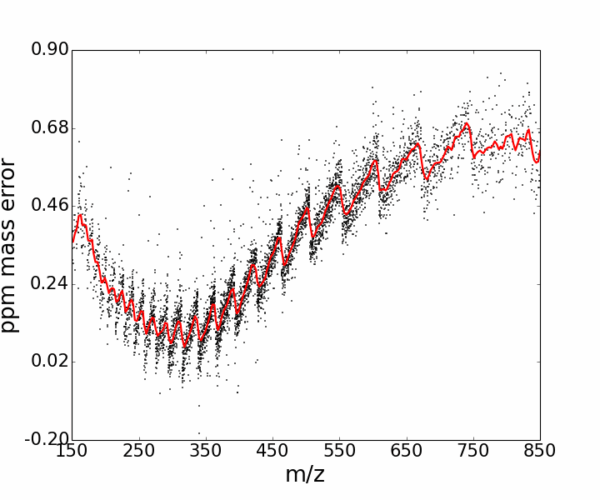
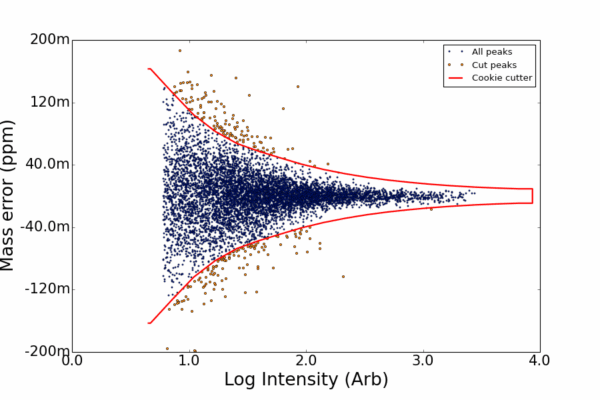
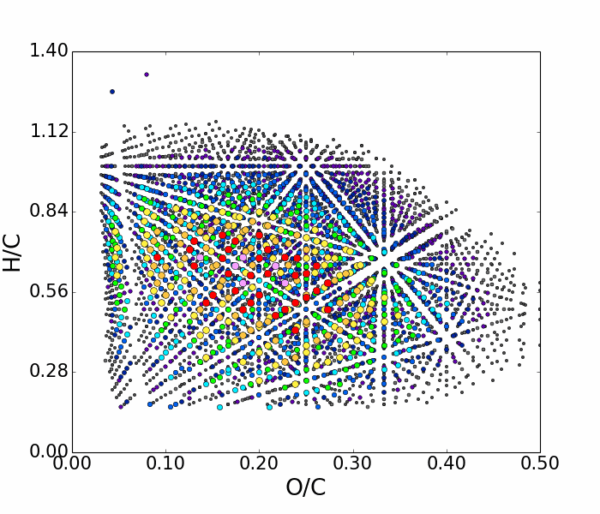
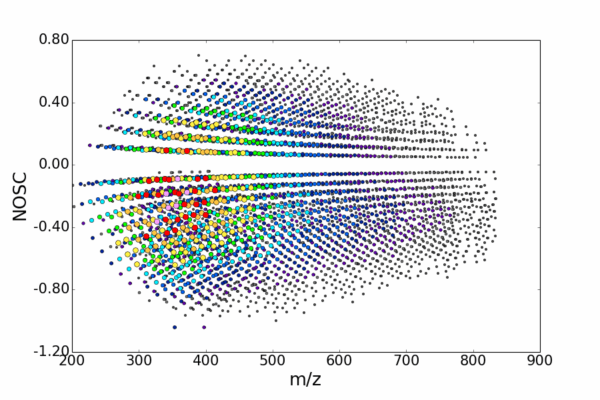
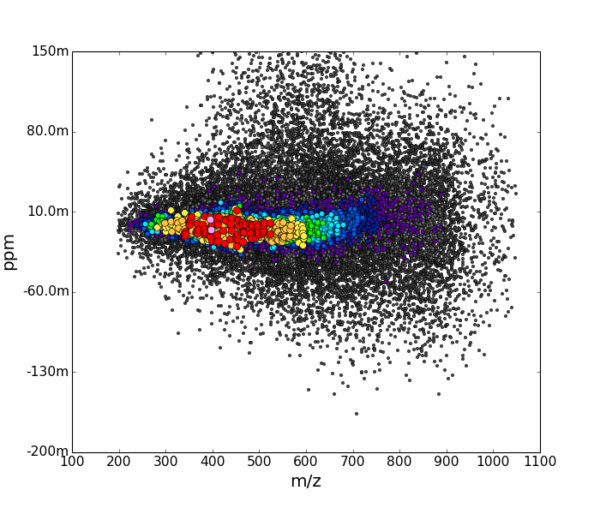
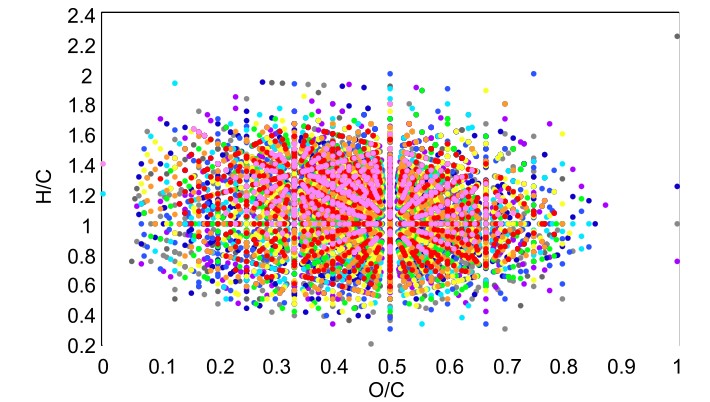
AutoLogis can display your data as mass spectral, two-dimensional Kendrick mass defect space view; van Krevelen diagrams; double bond equivalence and z plots; and in mass error plots. This data can be easily exported as figures or even directly to Excel. The heat map outputs can be exported as images or as vector files. Having these views exported as vector files makes it very easy for users to create publication quality images for journal papers or posters, with no fears about pixelation or losses in image quality.
AutoLogis can also generate 3D outputs for the assigned peaks. This can be very useful for visualizing complex datasets.
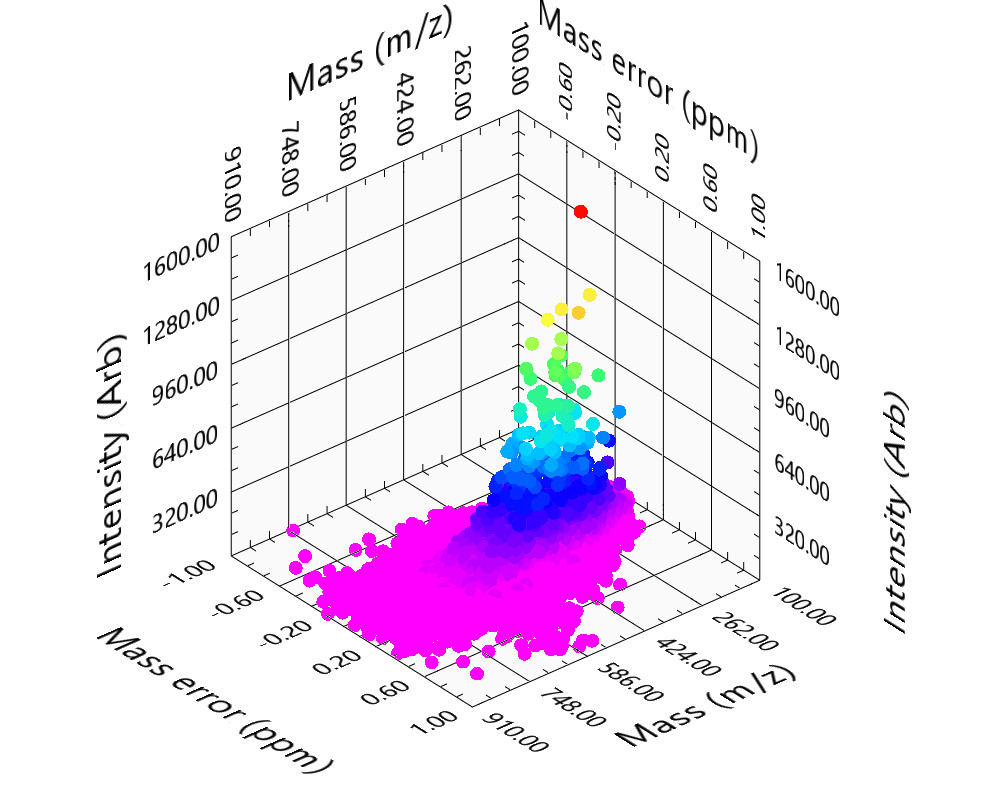
This 3D display allows the user to manipulate the view to let them explore the 3D shape of their data.
New Isotopic Distribution Capabilities
AutoLogis has some new capabilities – new tools and methods to allow you to make best use of the isotopic distribution (and fine-structure – is visible in your spectra) to make your assignment more confident and fast. Enjoy!
Commercial licenses and support are available for AutoVectis through Spectroswiss.
For collaborators who wish to partner in development of new features, other options are available. Please contact us for more information and to discuss your needs and ideas.
We are happy to provide examples of AutoVectis and Autophaser capability on trial data you send us for testing. We can also supply trial versions of all tools on a test license.